Steady second quarter performance as Citigroup delivers broad-based growth
Overview
Citigroup reported a strong second quarter in 2025, with balanced growth across all core business lines, supported by revenue expansion, transformation investments, and solid cost discipline. Net income rose by 25% year-over-year, while the company returned over $3 billion to shareholders amid a backdrop of macroeconomic uncertainty and ongoing strategic realignment.
CEO Jane Fraser highlighted: “We reported another very good quarter and continue to demonstrate that our strong results are sustainable through different environments. We’re improving the performance of each of our businesses to take share and drive higher returns. As I’ve said, next year’s 10-11% ROTCE target is a waypoint, not a destination. The actions we’ve taken have set up Citi to succeed long term, drive returns above that level and continue to create value for shareholders.”
Q2 2025 vs. Q2 2024:
- Net income was $4.0bn (+25% YoY), while diluted EPS increased to $1.96 (compared to $1.52 in Q2 2024).
- Revenues rose to $21.7bn (+8% YoY), driven by growth in each of Citi’s five business segments.
- Services revenue recorded a value of $5.1bn (+8% YoY), driven by growth in Treasury and Trade Solutions (TTS) and Securities Services.
- Net interest income increased 13%, supported by higher deposit and loan balances. Non-interest revenue declined 1%, due to higher lending revenue share with Banking and FX headwinds, partially offset by strong fee drivers.
- TTS revenues were $3.7bn (+7% YoY), reflecting a 12% increase in net interest income and a 9% decrease in non-interest revenue. Fee growth was supported by higher cross-border transaction volume (+9%) and USD clearing volume (+6%).
- Securities Services revenues were $1.4bn (+11% YoY), supported by a 14% increase in net interest income and an 8% increase in fee-based revenue, with assets under custody and administration up 17%.
- Markets revenues were $5.9bn (+16% YoY), with growth in both Fixed Income and Equities.
- Fixed Income markets revenues were $4.3bn (+20% YoY), led by strength in rates and currencies. Spread products and other fixed income rose 3%, aided by higher financing activity.
- Markets revenues were $5.9bn (+16% YoY), with growth in both Fixed Income and Equities.
- Equity markets revenues were $1.6bn (+6% YoY), supported by record prime balances (+27%) and higher activity in derivatives and cash equities.
- Banking revenues totaled $1.9bn (+18% YoY), with growth in both Investment Banking and Corporate Lending (excluding hedging impacts).
- Investment Banking revenues were $981m (+15% YoY), driven by 52% growth in Advisory and 25% growth in ECM, partially offset by a 12% decline in DCM.
- Corporate Lending revenues (ex. hedges) rose to $1.0bn (+31% YoY), driven by increased lending revenue share.
- Wealth revenues rose to $2.2bn (+20% YoY), driven by growth across Citigold, the Private Bank, and Wealth at Work.
- Private Bank revenues were $731m (+20% YoY), driven by wider deposit spreads and a gain on the sale of an alternative investments fund platform.
- Wealth at Work revenues were $221m (+13% YoY), while Citigold generated $1.2bn in revenues (+21% YoY), reflecting strong lending and investment fee momentum.
- U.S. Personal Banking (USPB) revenues rose to $5.1bn (+6% YoY), driven by Branded Cards and Retail Banking.
- Branded Cards revenues were $2.8bn (+11% YoY), supported by growth in interest-earning balances (+7%) and higher net interest margins.
- Retail Services revenues declined to $1.6bn (-5% YoY), due to higher partner payment accruals related to lower net credit losses.
- Retail Banking revenues were $648m (+16% YoY), benefiting from improved deposit spreads.
- Operating expenses rose slightly to $13.6bn (+2% YoY), with higher compensation and severance costs, partially offset by lower tax-related and regulatory expenses.
- Cost of credit increased to $2.9bn (+16% YoY), driven by a net ACL build tied to macroeconomic outlook deterioration and transfer risk exposure in Russia. Net credit losses were $2.2bn (-2% YoY).
- Return on Average Common Equity (ROCE) was 7.7%, while Return on Tangible Common Equity (ROTCE) was 8.7%.
- Book value per common share rose to $106.94 (+7% YoY), while tangible book value per share increased to $94.16 (+8% YoY).
- CET1 ratio stood at 13.5% (vs. 13.6% in Q2 2024), reflecting capital returns and growth in risk-weighted assets.
- The bank returned ~$3.1bn to shareholders in Q2 2025, including $2.0bn in share repurchases under its $20bn buyback program and dividends.
Citigroup remains committed to executing its strategic priorities while delivering returns and maintaining strong capital. Management emphasized continued transformation efforts, automation, and responsible AI deployment. With positive momentum across all segments, the bank is on track to meet its medium-term RoTCE targets.
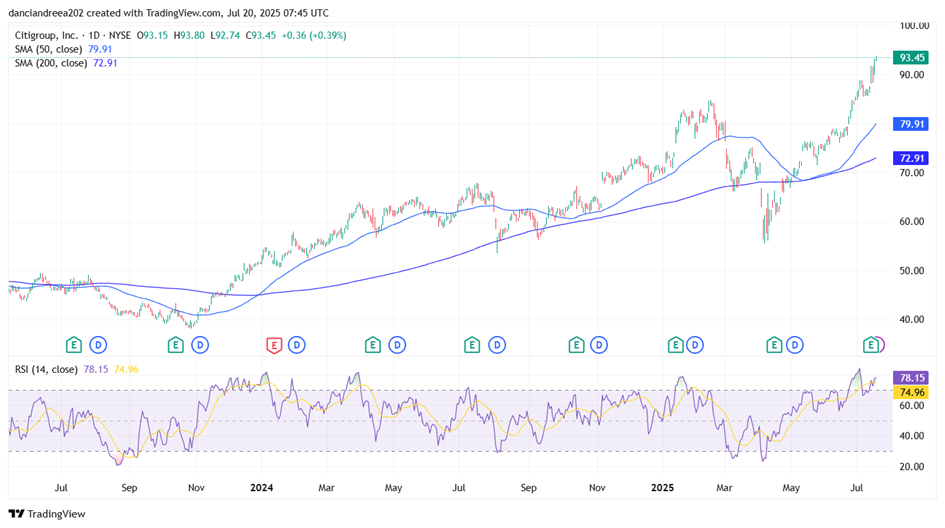
Citigroup has extended its bullish momentum following its Q2 2025 earnings report on July 15, gaining over 4% in the past five trading sessions. The stock is now trading well above both its 50-day and 200-day SMA, confirming a solid uptrend. The RSI has climbed to 78.15, entering overbought territory, which signals strong buying pressure but also raises the potential for short-term consolidation. This breakout to fresh multi-month highs suggests growing investor confidence, and the recent price action reinforces the strength of the post-earnings rally. While the current trend remains positive, traders may watch for signs of cooling momentum near $94-$95 or a healthy pullback toward the $88-$90 zone for potential support.
Author: Andreea-Roxana Danci
Discover more from FSEGA Investment Club
Subscribe to get the latest posts sent to your email.