A careful climb in Delta’s second quarter performance

Overview
Delta Air Lines reported its June quarter (Q2 2025) results, delivering record adjusted revenue and maintaining strong double-digit margins despite cost pressures and softer unit revenue trends. While earnings and margins declined modestly year over year, the company continued to benefit from resilient demand in premium products, steady international growth, and a robust loyalty program. Management reaffirmed its full-year guidance for earnings and free cash flow, highlighting confidence in its strategy and financial discipline. Additionally, Delta announced a 25% increase in its quarterly dividend starting in the September quarter, signaling a clear commitment to returning value to shareholders.
CEO Ed Bastian said: “In the June quarter, Delta delivered record revenue on a 13 percent operating margin, generating $1.8 billion in pre-tax profit and leading network peers across key operational metrics. This strong performance is a direct reflection of the outstanding contributions of our people, who continue to set the bar for industry performance.”
Q2 2025 vs. Q2 2024:
- Total operating revenue was essentially flat at $16.65bn (-$10m YoY).
- Passenger revenue remained at $13.87bn (+$26m YoY), while Cargo revenue increased to $212m (+7% YoY).
- Premium product revenue up 5% YoY, while Main Cabin ticket revenue declined 5%.
- Loyalty program revenue grew 8% YoY, boosted by 10% higher American Express remuneration.
- International revenue grew 2% YoY, led by an 11% increase in Transpacific driven by double-digit capacity growth.
- Domestic revenue was slightly down (-1% YoY), despite steady corporate demand.
- Adjusted operating revenue rose to $15.5bn (+1% YoY), driven by 4% capacity growth.
- Adjusted TRASM (unit revenue) fell 3% YoY, reflecting softer pricing trends.
- Total operating expenses increased slightly to $14.55bn (+1% YoY), with salaries and related costs of $4.40bn (+10% YoY), contracted services of $1.16bn (+11% YoY) and landing fees and other rents of $878m (+12% YoY). However, aircraft fuel and related taxes declined to $2.46bn (-13% YoY).
- Non-fuel costs rose to $10.48bn (+7% YoY), with non-fuel unit costs (CASM-Ex) up 2.7% YoY.
- Adjusted fuel expense fell to $2.5bn (-11% YoY), as average fuel price dropped 14% to $2.26/gal.
- Operating income fell to $2.1bn (-7% YoY), with margin declining to 12.6% (-1.0 pts).
- Adjusted operating income declined to $2.05bn (-10% YoY), with margin contracted to 13.2% from 14.7%.
- Pre-tax income jumped to $2.57bn (+45% YoY), supported by significant investment gains, while adjusted pre-tax income fell to $1.8bn (-10% YoY).
- Net income surged to $2.13bn (+63% YoY), with diluted EPS of $3.27 (compared to $2.01 in Q2 2024).
- Adjusted net income dropped to $1.37bn (-10% YoY), with adjusted EPS of $2.10 (vs. $2.36 in Q2 2024).
- Operating cash flow fell to $1.84bn (-25% YoY), while free cash flow also fell to $733m (-42% YoY), reflecting higher debt repayments and CapEx of $1.17bn (-4% YoY).
- Adjusted net debt reduced by $1.7bn from year-end to $16.3bn.
- Liquidity stood at $6.4bn, with $3.1bn in undrawn revolver capacity.
Delta Air Lines maintains a cautiously optimistic outlook for the rest of 2025, reaffirming full-year guidance of $5.25-$6.25 EPS and $3bn-$4bn in free cash flow while targeting gross leverage below 2.5x. For Q3, it projects flat to modestly higher revenue growth (0-4% YoY), an operating margin of 9-11%, and EPS between $1.25 and $1.75. Management expects unit revenue trends to improve in the second half as capacity aligns with demand, supported by strong premium and loyalty revenue, disciplined cost control, and continued debt reduction, highlighting a focus on sustaining margins, cash flow, and shareholder returns despite a more competitive industry backdrop.
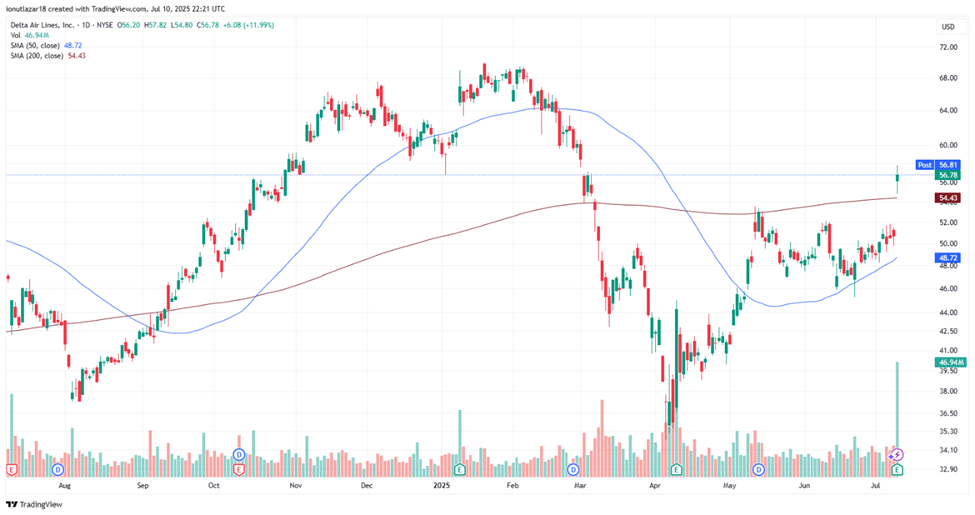
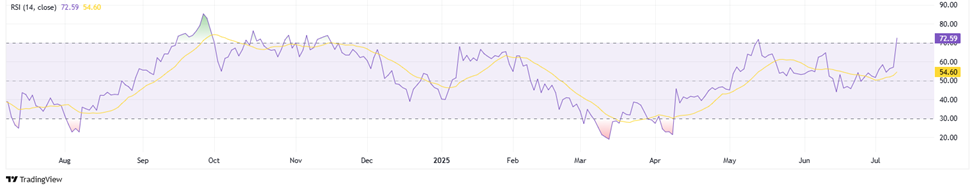
Following the publication of the financial results for the second quarter of 2025, DAL shares recorded an extremely positive reaction, marking an appreciation of almost +12% in the most recent session, on a volume almost double the recent average. From a technical perspective, this movement allowed the price to simultaneously break through the 50-day and 200-day simple moving averages, levels considered significant resistance barriers, suggesting a potential trend change from sideways or downward to upward. Another important aspect is the behavior of the RSI indicator, which rose to 72.6, signaling the entry into the overbought zone. This reflects a very strong buying impulse and validates the breakout, but also indicates the risk of a possible consolidation or correction in the short term. Therefore, the post-results technical analysis supports a bullish perspective confirmed by volume and price structure, but also suggests careful risk management, given the high levels of momentum that may generate additional volatility in the coming period.
Author: Ionuț-Adrian Lazar
Discover more from FSEGA Investment Club
Subscribe to get the latest posts sent to your email.