Fast Food – A Healthy Choice for Investors?
As the below analysis shows, over the last 10 years, the Fast-Food industry has seen a relatively quick growth, despite a material setback in 2020, as a result of the pandemic. For this, we used the annual data of 5 of the biggest restaurant chains in the US – McDonald’s Yum! Brands, Restaurant Brands International, Chipotle and Domino’s Pizza.
Please note that while McDonald’s, Chipotle and Domino’s operate under a single brand, Yum! Brands and Restaurant Brands International have multiple under management:
- Yum! Brands includes KFC, Pizza Hut, Taco Bell, as well as other smaller brands
- Restaurant Brands International includes Burger King, Tim Hortons, Popeyes and others
Results
Overall, we’ve found that EBIT margins have increased over the last 10 years, at an average of c.28% in 2024, up from 23% in 2015. Additionally, EPS growth has accelerated, especially in the post-pandemic era, while DPS has increased consistently over the years (roughly in line with EPS, as capital returns are highly dependent on earnings). Another interesting finding is that the total number of locations has increased by c.40% since 2015, from 115k, to 162k, with Yum! Brands alone accounting for ~20k. Turning our attention the indiviual companies, we’ve found the following:
- The biggest surprise to us was Chipotle. Earlier this year, hedge fund manager Bill Ackman decided to invest heavily in Chipotle, which now accounts for c.20% of Pershing Square, his fund. Given that, we were pleasantly surprised by the quality of Chipotle’s operations, as they’ve recorded the highest revenue and EBIT growth rates. What’s perhaps most interesting though, is that Chipotle is the only one of the companies to have >$1m/location (actually over $3m in 2024), though this is likely a result of most of the locations being in the US. What is less impressive though, is that management doesn’t intend to return capital to investor in the form of DPS, but it somewhat makes sense, given that the company is still in a growth phase, both in terms of revenue, as well as the number of locations. Also, Chipotle has registered the lowest EBIT margin across the companies, which is slightly disappointing.
- McDonald’s is probably the most well-known fast-food chain in the world, operating in >120 countries globally. While we were disappointed by the almost flat revenue growth, it is important to mention that in 2020, McDonald’s suffered a serious hit a result of COVID, and if looking only at 2020-2024, it actually had a +8% CAGR. On the other hand, though, McDonald’s had by far the highest EBIT margin, consistently over 40% in the last 4 years.
- Restaurant Brands International, which includes among others, Burger King and Popeyes, had the highest EPS growth, almost +23% p.a. and, subsequently, the highest DPS growth rate (+20% CAGR), although it didn’t stand out in terms of any of the other metrics.
- Yum! Brands, which includes KFC, Pizza Hut and Taco Bell, had relatively modest revenue growth at c.+2%, although it had the 2nd highest EBIT margin over the last 4 years. Additionally, on an EPS basis, they were the weakest out of the 5 companies.
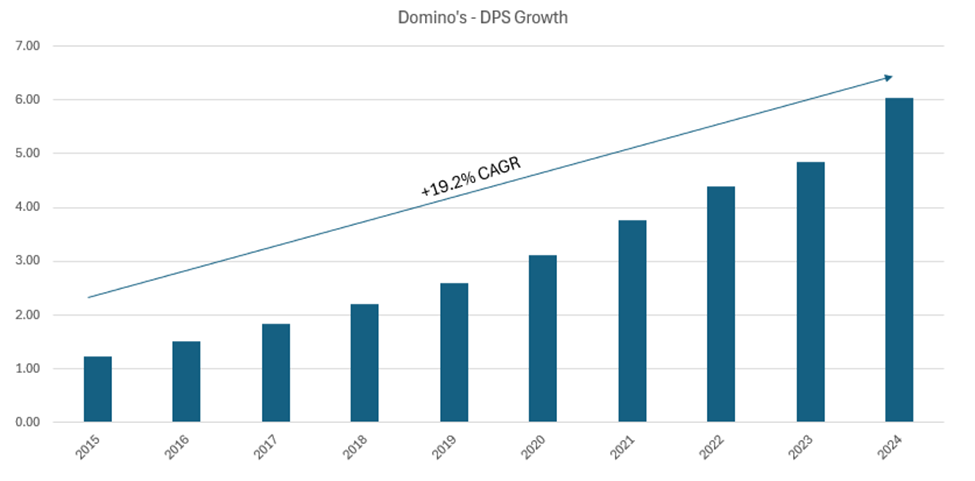
- Finally, Domino’s Pizza was the least interesting of the 5 companies in our opinion. While they had solid revenue and EBIT growth, the margins were relatively low and they had the 2nd lowest CapEx ratio as well. The one positive, however, was the DPS growth, at >19% CAGR.
Overall, we believe the fast food sector is a particularly good choice for those who want to invest in a more stable, less cyclical industry. One of our findings was that 4 of the 5 companies offer capital returns to investors, in the form of dividends paid annually (the only exception being Chipotle). Alternatively, for those who want to invest in a still growing part of the sector, Chipotle might be a good alternative, given its recent growth track record, as well as solid stock price performance.
Overview
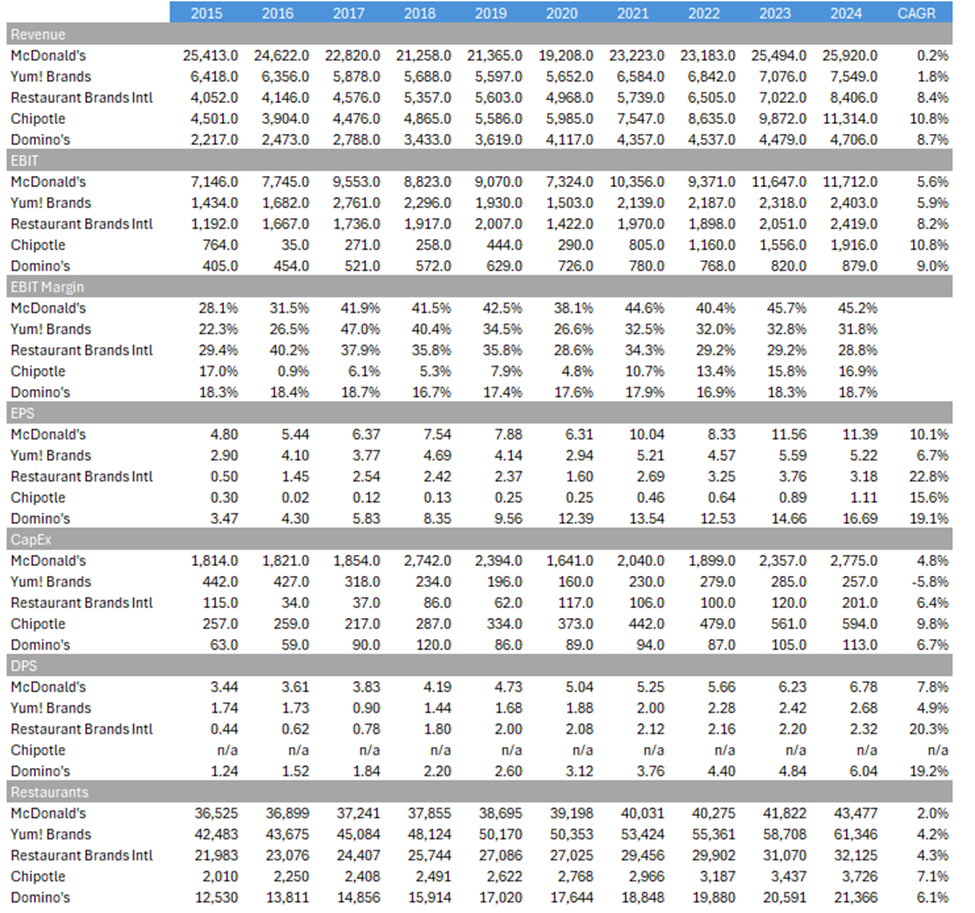
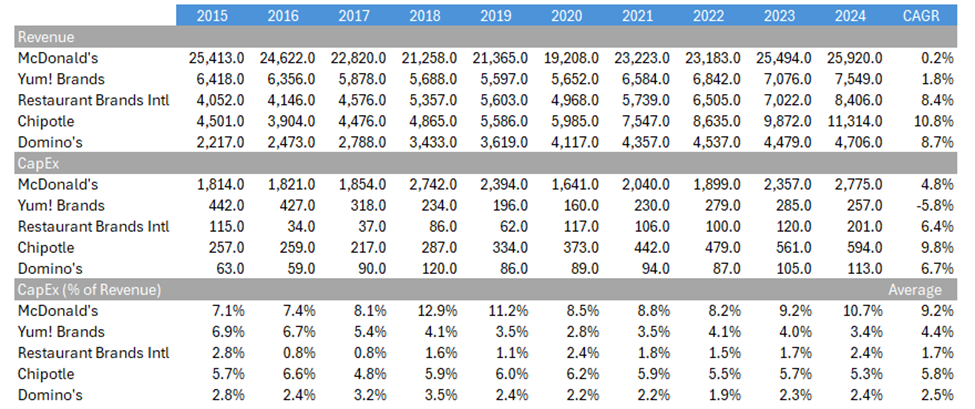
The table below summarizes the data for the 5 companies, for the 2015-2024 period (as 2024 was the last reported fiscal year). The figures for revenue, EBIT and CapEx are in $m, while all the other figures are the actual numbers.
Figure 1 – Overview of the sector
Stock Price Performance vs. S&P500
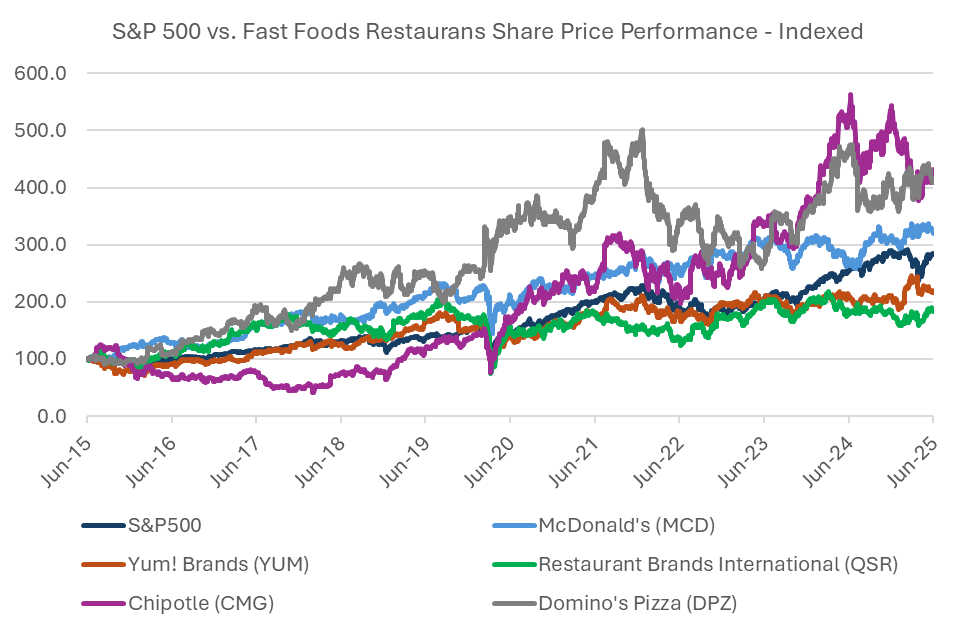
Looking at the performance of the 5 restaurant chains against that of the S&P500, it is obvious that over the past 10 years, Chipotle, Domino’s and McDonald’s (although just slightly) outperformed the market, while Yum! Brands and Restaurant Brands International have underperformed. It is perhaps even more interesting that, on one hand while Chipotle heavily underperformed in the pre-COVID period, it has since seen a really quick increase, as a result of quick revenue growth (+17% CAGR since 2020), improved margins (the EBIT margin, for example, improved by +12%pts since the beginning of the pandemic), as well as an impressive EPS growth (+45% CAGR between 2020-2024). On the other hand, despite it being the largest among the analyzed companies, and outperforming both the market and the segment for almost the entire period, we notice that McDonald’s has underperformed following the pandemic, and the gains throughout 2021 have vanished in 2022. Despite this, we note that on a fundamental level, McDonald’s is still in a great position, with a >40% EBIT margins, and a c.8% DPS growth.
Figure 2 – S&P 500 vs. Fast Foods Restaurants Share Price Performance – Indexed
Stable Revenue Growth
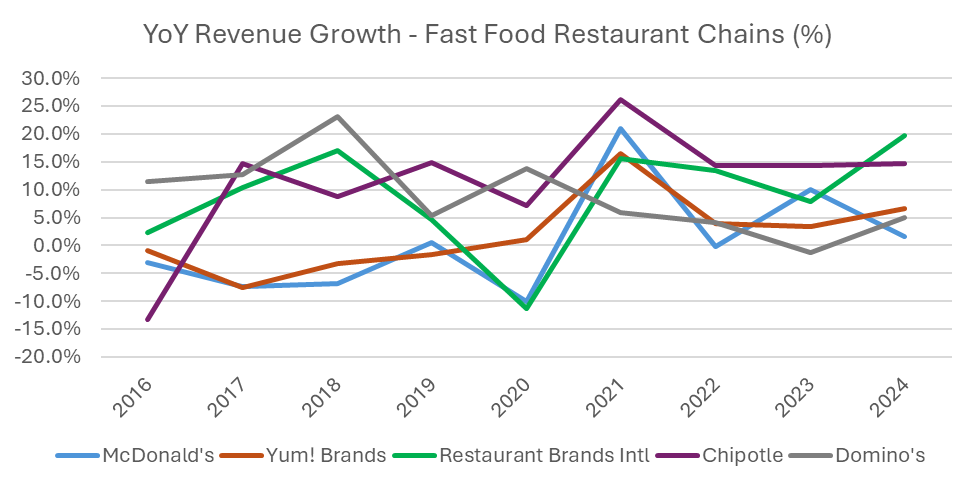
Overall, between 2015-2024, the combined revenue of the 5 fast-food restaurant chains grew by +3.5% p.a., which would have been higher had it not been for the material setback caused by the COVID-19 pandemic. While Chipotle, as noted above, has grown by almost +11% per year, McDonald’s has slightly underperformed again, with a modest +0.2% annual growth. It is also important to note that, among the 5 companies, McDonald’s has also had the lowest growth in terms of the number of locations, with only a +2.0% p.a. growth (although it has almost 15x more locations than Chipotle, and double that of Domino’s).
Figure 3 – YoY Revenue Growth of the sector
McDonald’s – Revenue Growth
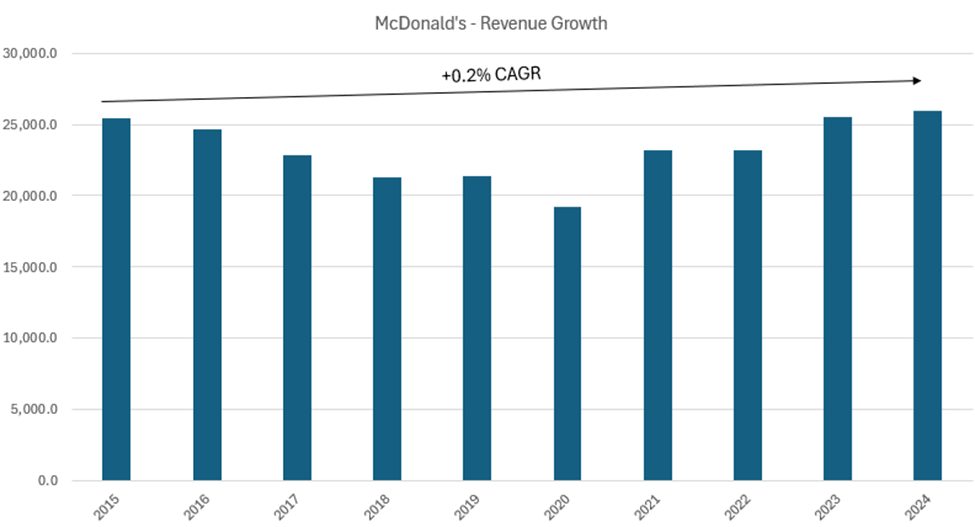
Between 2015 and 2024, McDonald’s revenue shows a relatively flat trend overall, with some clear fluctuations. After declining from 2015 through 2018, it stabilized in 2019 before experiencing a sharp drop in 2020 due to the pandemic. However, the company recovered strongly from 2021 onwards, with revenue reaching its highest level in 2024. Despite this rebound, the long-term average growth has been minimal, highlighting the challenges of achieving consistent expansion in a mature market.
Figure 4 – Revenue Growth of the McDonald’s (2015-2024)
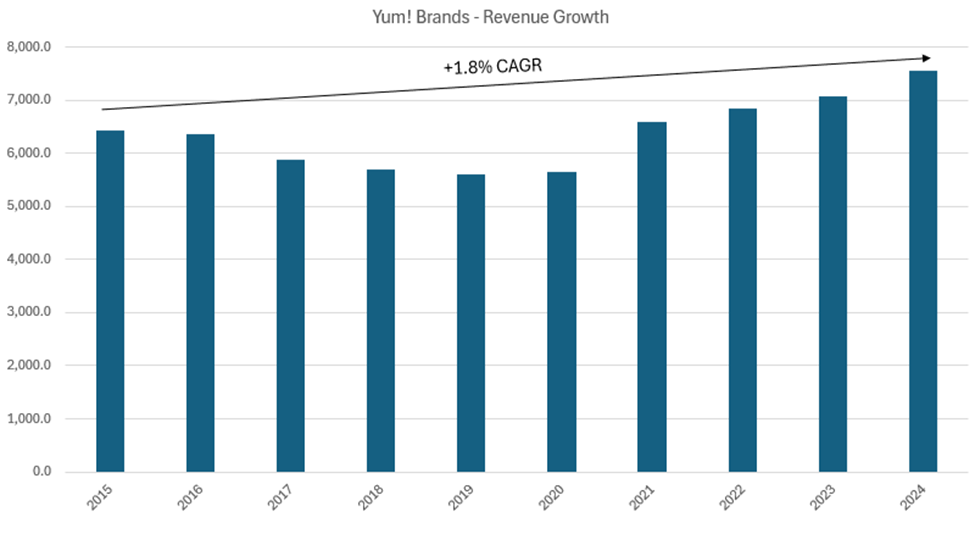
Yum! Brands – Revenue Growth
Between 2015 and 2024, Yum! Brands’ revenue shows a modest upward trend overall. After declining steadily from 2015 through 2019, revenue remained stable in 2020 despite the impact of the pandemic. From 2021 onwards, the company saw a consistent recovery, with revenue reaching its highest level in 2024. This reflects a relatively low but positive long-term growth rate of around +1.8% CAGR, highlighting steady expansion in the period despite earlier setbacks.
Figure 5 – Revenue Growth of the Yum! Brands (2015-2024)
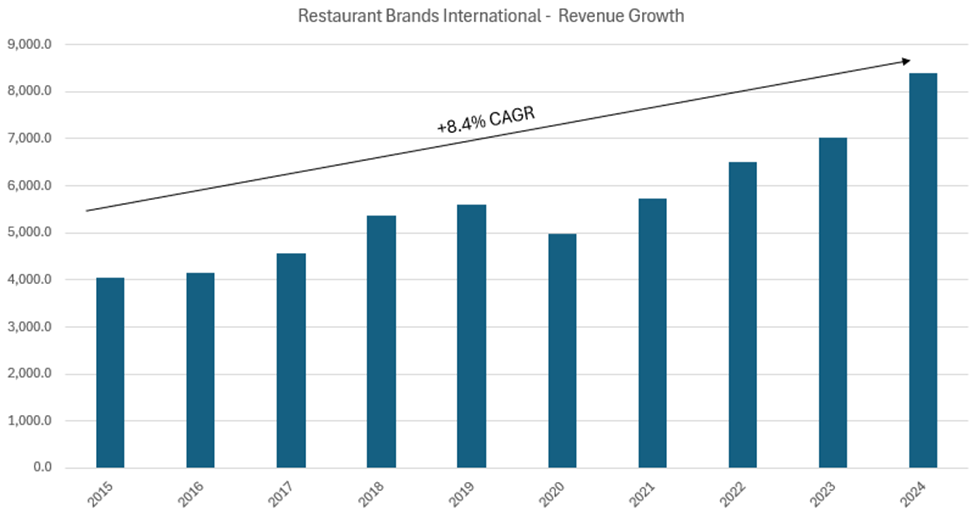
Restaurant Brands International – Revenue Growth
Between 2015 and 2024, Restaurant Brands International’s revenue shows a clear upward trend overall. After steady gains from 2015 through 2019, revenue dipped in 2020 during the pandemic but recovered quickly in the following years. From 2021 onwards, the company achieved consistent growth, with revenue reaching its highest point in 2024. This translates to a strong long-term average growth rate of around +8.4% CAGR, highlighting sustained expansion over the period.
Figure 6 – Revenue Growth of the Restaurant Brands International (2015-2024)
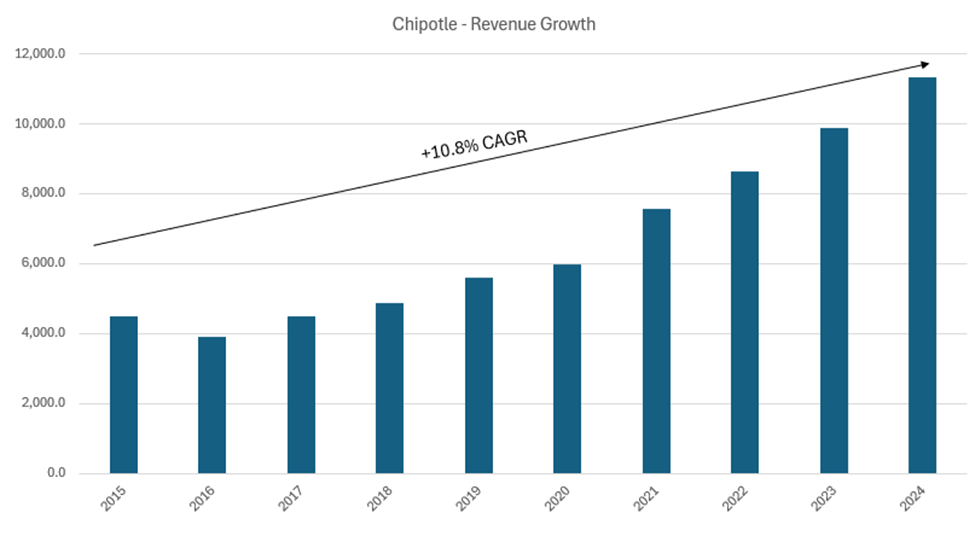
Chipotle – Revenue Growth
Between 2015 and 2024, Chipotle’s revenue shows a strong and consistent upward trend overall. After a dip in 2016, revenue recovered steadily through 2019 and maintained positive momentum even during 2020. From 2021 onwards, growth accelerated significantly, with revenue reaching its highest level in 2024. This translates to an impressive long-term average growth rate of around +10.8% CAGR, reflecting rapid expansion over the period.
Figure 7 – Revenue Growth of the Chipotle (2015-2024)
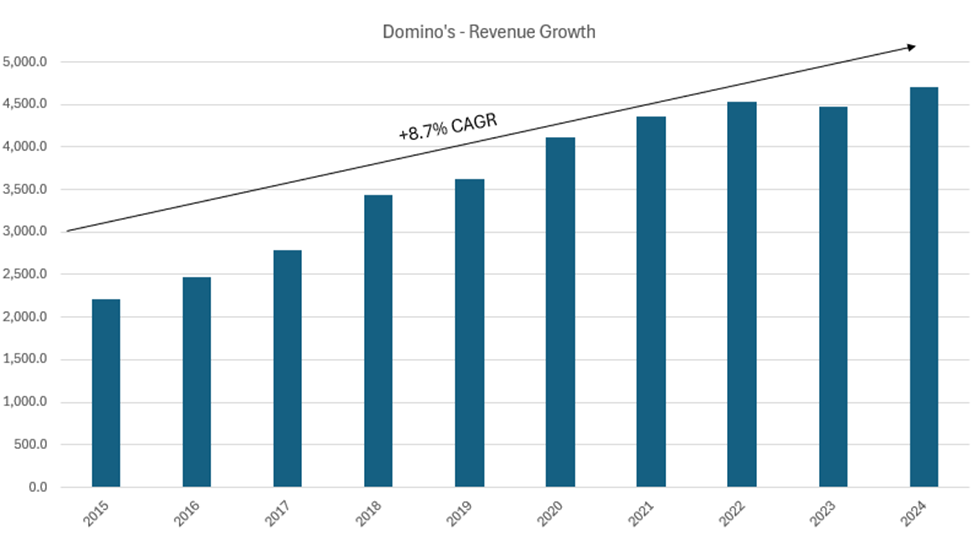
Domino’s – Revenue Growth
Between 2015 and 2024, Domino’s revenue shows a steady and consistent upward trend overall. Revenue increased each year from 2015 through 2021, with only a minor fluctuation from 2022 to 2023. By 2024, it reached its highest level in the period. This reflects a solid long-term average growth rate of around +8.7% CAGR, highlighting strong and sustained expansion throughout the decade.
Figure 8 – Revenue Growth of the Domino’s (2015-2024)
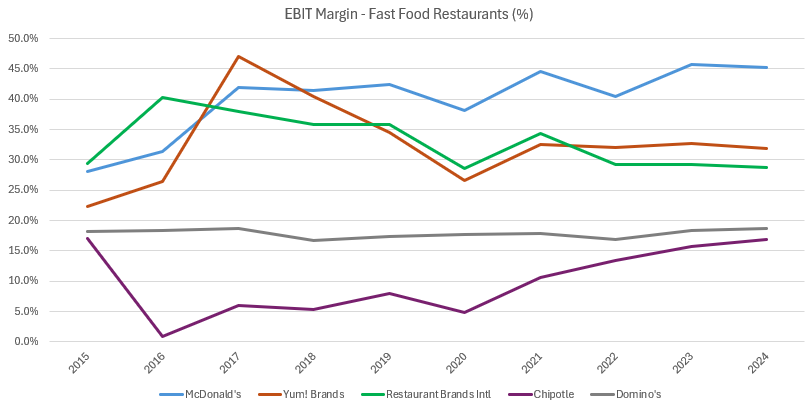
EBIT Margin
Overall, between 2015–2024, the average EBIT margins of the five fast-food chains have remained relatively stable, despite significant individual variations and the clear impact of the pandemic. McDonald’s maintained consistently high margins, averaging over 40% in recent years, while Yum! Brands saw a sharp increase to nearly 47% in 2017 before gradually declining toward 32% by 2024. Restaurant Brands International’s margins fell slightly over the period, reflecting competitive pressures and pandemic recovery challenges. Notably, Chipotle rebounded impressively from near-zero margins in 2016 to over 16% by 2024, showing the most dramatic improvement in the group, with spectacular increases in EBIT, even 674% YoY. Domino’s maintained steady margins throughout, with a small upward trend, underscoring its consistent operational performance.
Figure 9 – EBIT Margin of the sector (2015-2024)
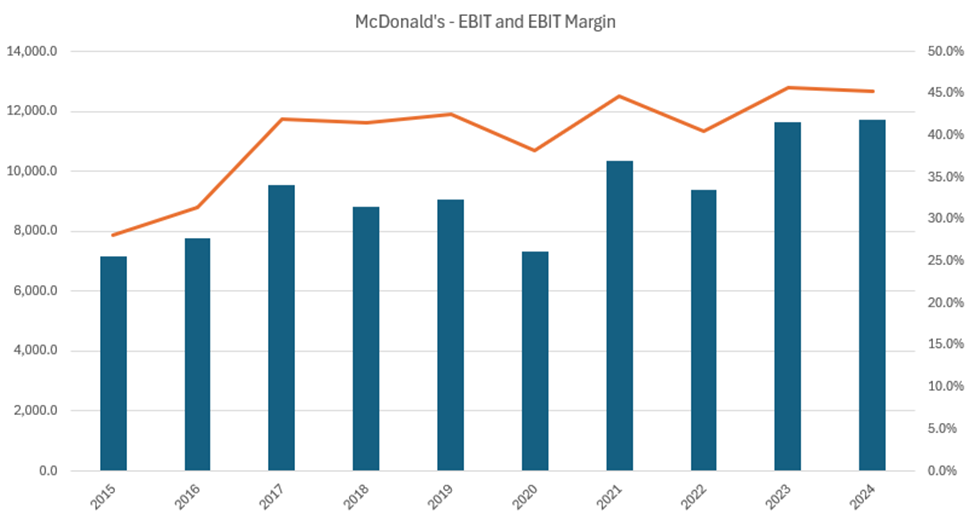
McDonald’s – EBIT and EBIT Margin
Between 2015 and 2024, McDonald’s EBIT and margin show a generally strong and resilient trend overall. EBIT grew steadily through 2019 before dipping in 2020 during the pandemic, but recovered quickly from 2021 onwards, reaching its highest levels by 2023 and 2024. The EBIT margin remained robust throughout the period, averaging above 40% in recent years, with a peak close to 46% in 2023. This reflects McDonald’s ability to maintain high profitability despite temporary setbacks, highlighting the strength of its mature and highly efficient operating model.
Figure 10 – EBIT and EBIT Margin of the McDonald’s (2015-2024)
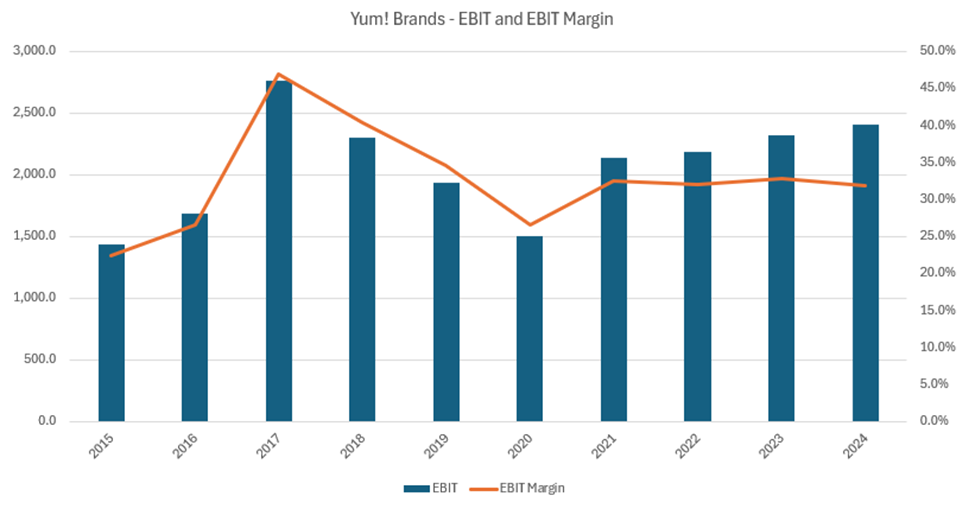
Yum! Brands – EBIT and EBIT Margin
Between 2015 and 2024, Yum! Brands’ EBIT and margin show a more variable trend overall. EBIT and margins rose sharply through 2017, reaching a peak margin of nearly 47%, before declining steadily over the following years. Despite a temporary dip in 2020, EBIT recovered from 2021 onwards, with modest growth through 2024. Meanwhile, the EBIT margin stabilized around 32%–33% in recent years, reflecting a return to more sustainable profitability after earlier highs.
Figure 11 – EBIT and EBIT Margin of the Yum! Brands (2015-2024)
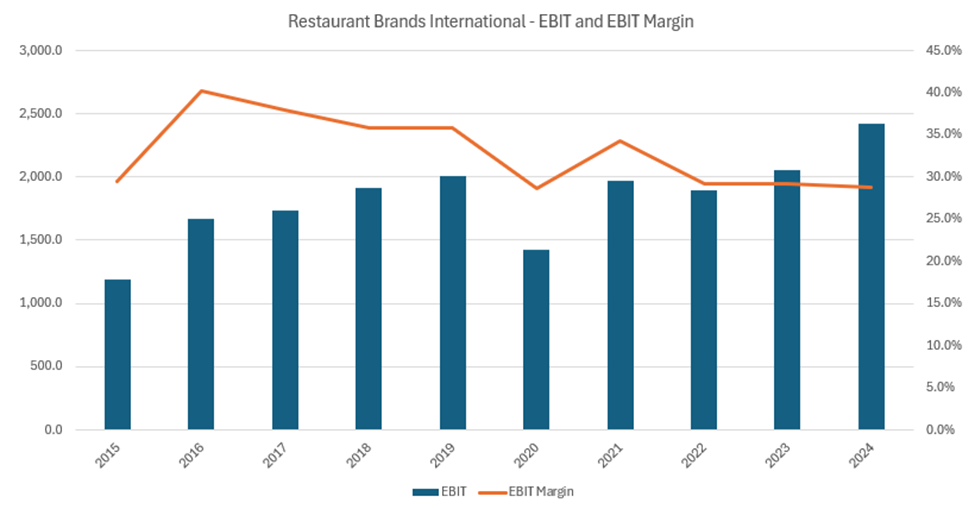
Restaurant Brands International – EBIT and EBIT Margin
Between 2015 and 2024, Restaurant Brands International’s EBIT and margin show a mixed but overall resilient trend. EBIT grew steadily from 2015 through 2019 before falling sharply in 2020, then recovering gradually to reach its highest level by 2024. The EBIT margin peaked near 40% in 2016 but declined steadily over the period, stabilizing around 29%–30% in recent years. This reflects solid absolute profit growth alongside pressures on profitability ratios in a competitive market.
Figure 12 – EBIT and EBIT Margin of the Restaurant Brands International (2015-2024)
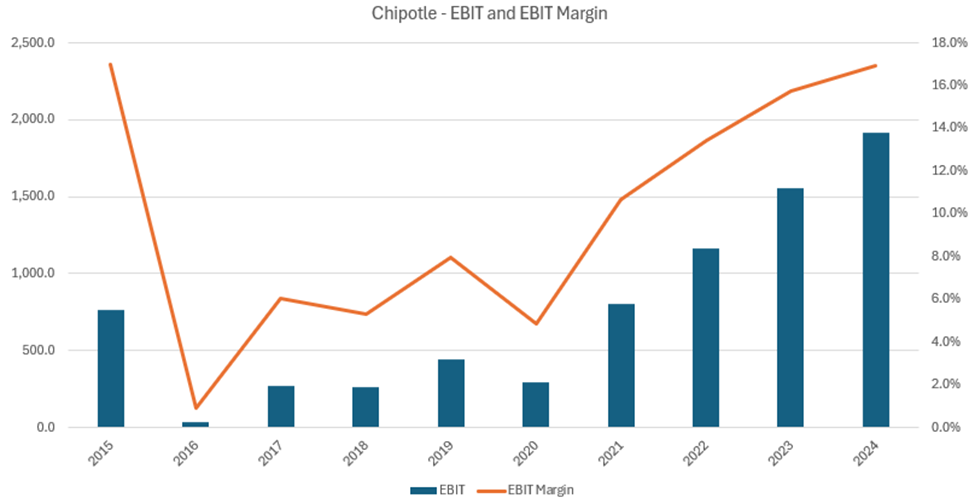
Chipotle – EBIT and EBIT Margin
Between 2015 and 2024, Chipotle’s EBIT and margin show a dramatic recovery and sustained improvement. After a sharp drop in 2016 to near-zero levels, EBIT and margins began to recover steadily, with particularly strong growth from 2021 onward. By 2024, both EBIT and EBIT margin reached their highest levels of the period, with margins climbing to approximately 17%. This reflects Chipotle’s successful turnaround and consistent profitability gains following earlier operational challenges.
Figure 13 – EBIT and EBIT Margin of the Chipotle (2015-2024)
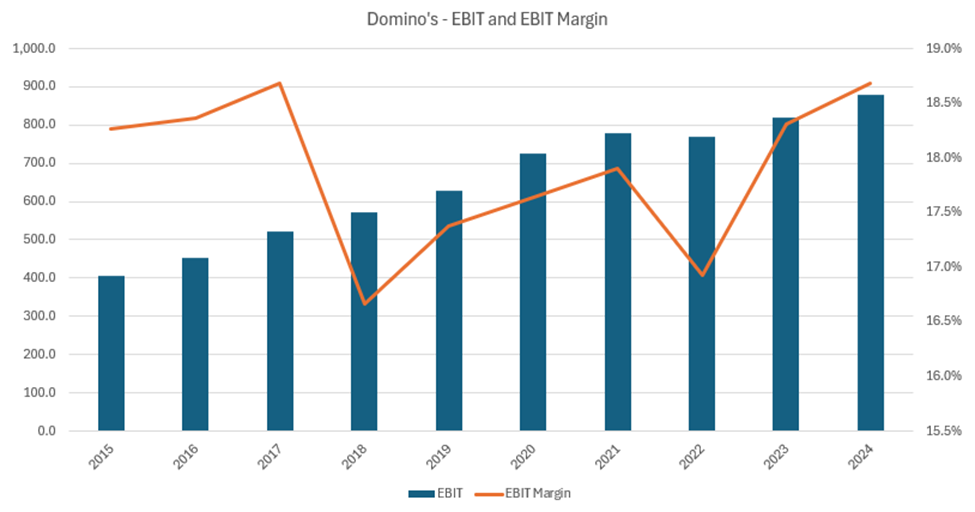
Domino’s – EBIT and EBIT Margin
Between 2015 and 2024, Domino’s EBIT and margin show a steady and consistent upward trend overall. EBIT increased nearly every year, with only minor fluctuations, reaching its highest level in 2024. The EBIT margin remained relatively stable throughout the period, fluctuating modestly between 16% and 19%, and finishing at its peak by 2024. This reflects Domino’s disciplined cost management and reliable profitability as it expanded.
Figure 14 – EBIT and EBIT Margin of the Domino’s (2015-2024)
Earnings per Share (EPS)
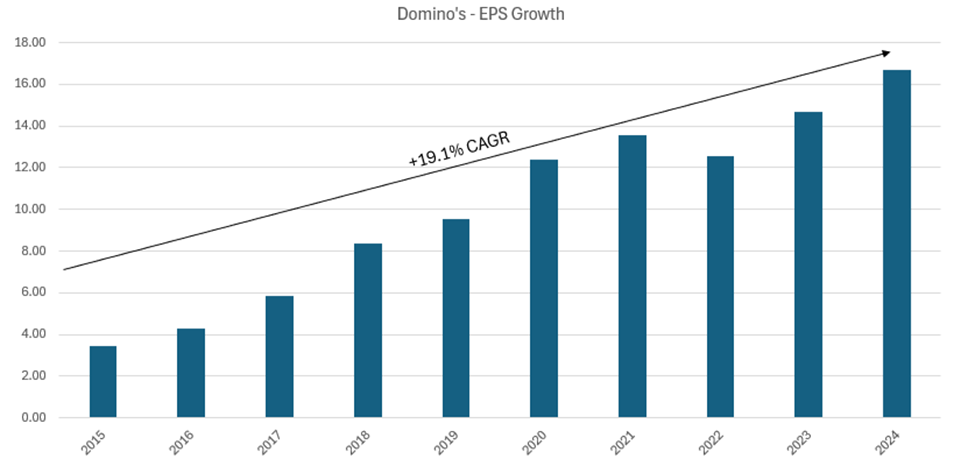
Turning our attention to EPS, we notice that earnings have been quite volatile across the industry, and not just in the post-pandemic period. For instance, in 2016, Chipotle’s EPS dropped by -93%, only to grow by +500% in the following year. Focusing on Chipotle, it’s safe to say that they’ve grown quickly, by c.+15% per year, and while we see this as an impressive growth rate, it’s still materially below Restaurant Brands International, which had a c.+23% CAGR. At the opposite end, Yum! Brands had the lowest growth rate in the sector, slightly below a +7% CAGR.
Figure 15 – EPS Growth of the sector (2015-2024)
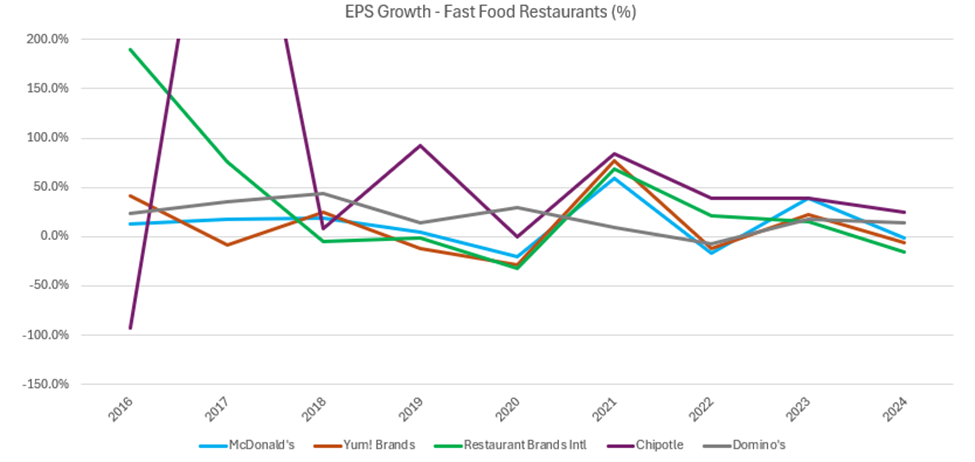
Figure 16 – EPS Growth of the McDonald’s (2015-2024)
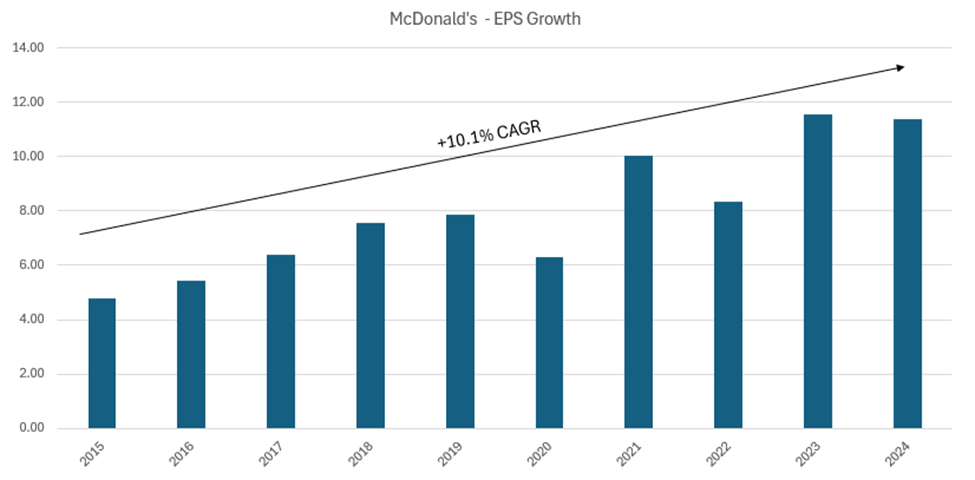
Figure 17 – EPS Growth of the Yum! Brands (2015-2024)
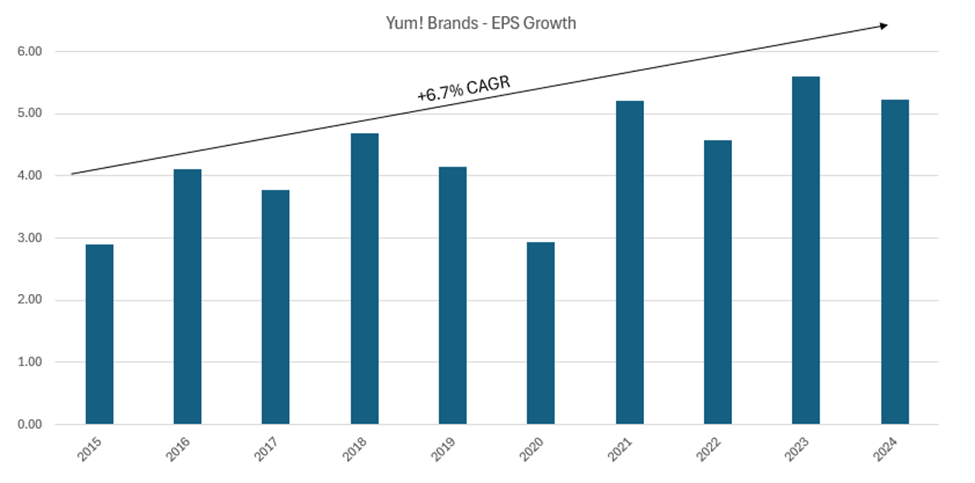
Figure 18 – EPS Growth of the Restaurant Brands International (2015-2024)
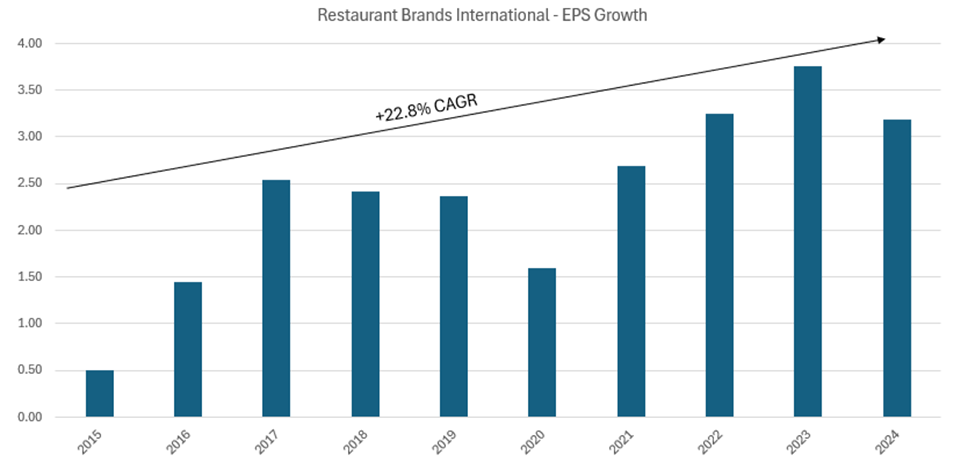
Figure 19 – EPS Growth of the Chipotle (2015-2024)
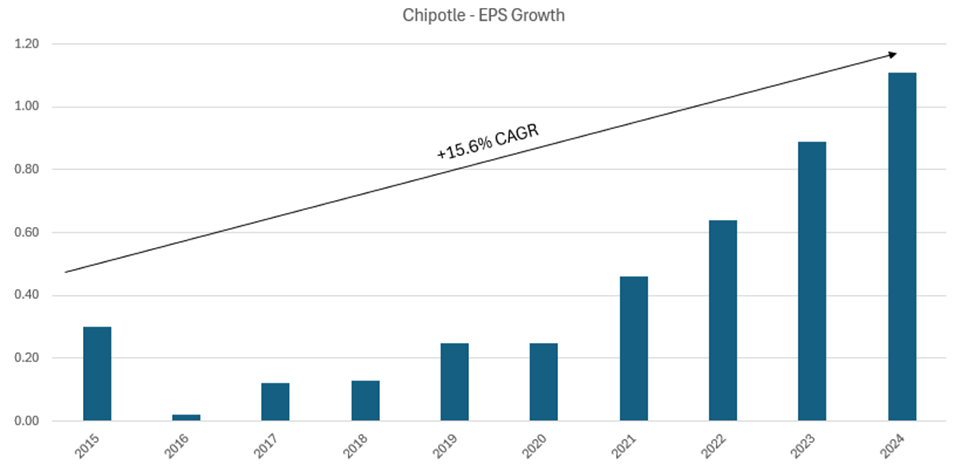
Figure 20 – EPS Growth of the Domino’s (2015-2024)
Dividend per Share (DPS)
It is important to mention that among the 5 companies that we’ve included in our analysis, only 4 of them have stable capital returns, in the form of dividends, as Chipotle stated in their most recent, 2024 Annual Report that “We are not required to pay any dividends and have not declared or paid any cash dividends on our common stock. We intend to continue to retain earnings for use in the operation and expansion of our business and to repurchase shares of common stock (subject to market conditions) and therefore do not anticipate paying any cash dividends on our common stock in the foreseeable future.” With this in mind, we only looked at the other 4 companies in terms of the DPS. While the EPS has dropped for each of the companies in 2020, as the pandemic had a powerful and unpleasant effect on the restaurant industry, we can see that there wasn’t a similar drop in terms of the DPS. Actually, each of the 4 companies had consistently grown their annual DPS figure. Restaurant Brands International had the highest DPS CAGR (although it is important to mention that c.+130% growth in 2016 was only offsetting a previous decline) at +20.3% (which is unsurprising, given that they’ve also had the highest EPS CAGR), while Domino’s ended up being a close second, with a c.+19% CAGR. Given its relatively modest EPS growth, it’s not surprising that Yum! Brands also had the lowest DPS growth rate, just shy of +5%.
Figure 21 – DPS Growth of the sector (2015-2024)
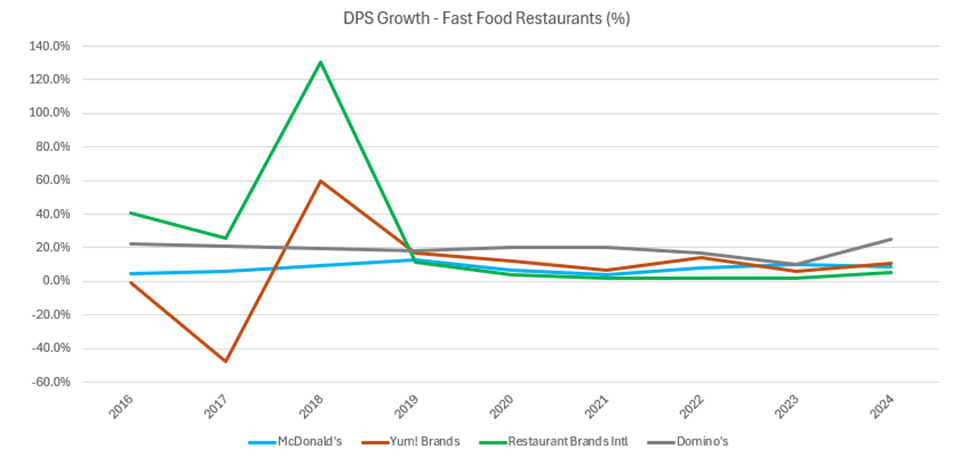
Figure 22 – DPS Growth of the McDonald’s (2015-2024)
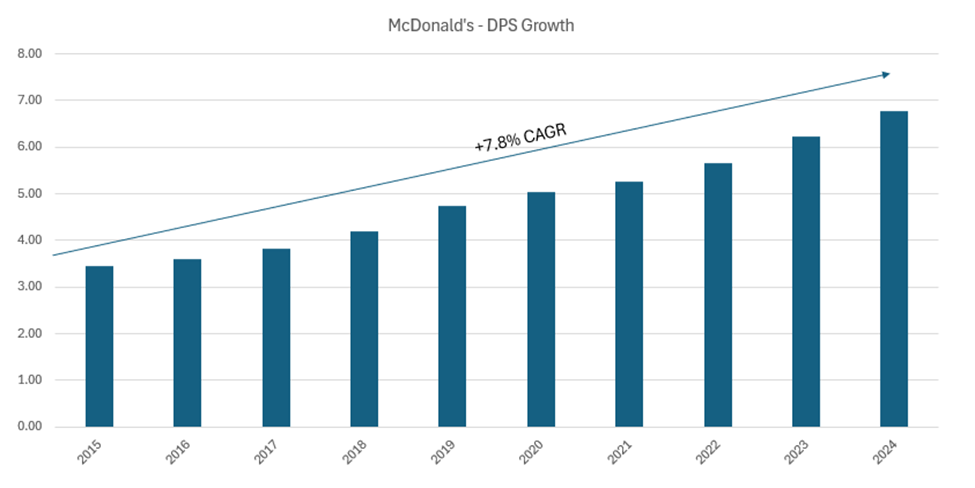
Figure 23 – DPS Growth of the Yum! Brands (2015-2024)
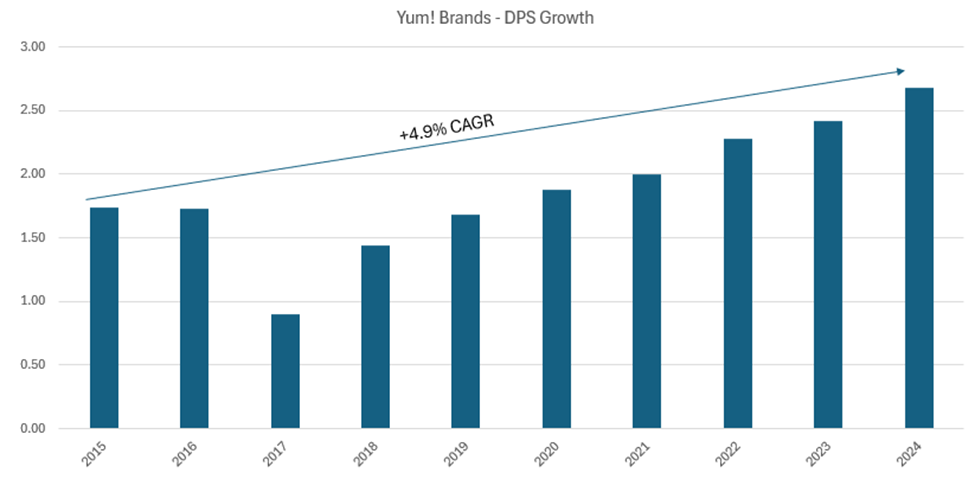
Figure 24 – DPS Growth of the Restaurant Brands International (2015-2024)
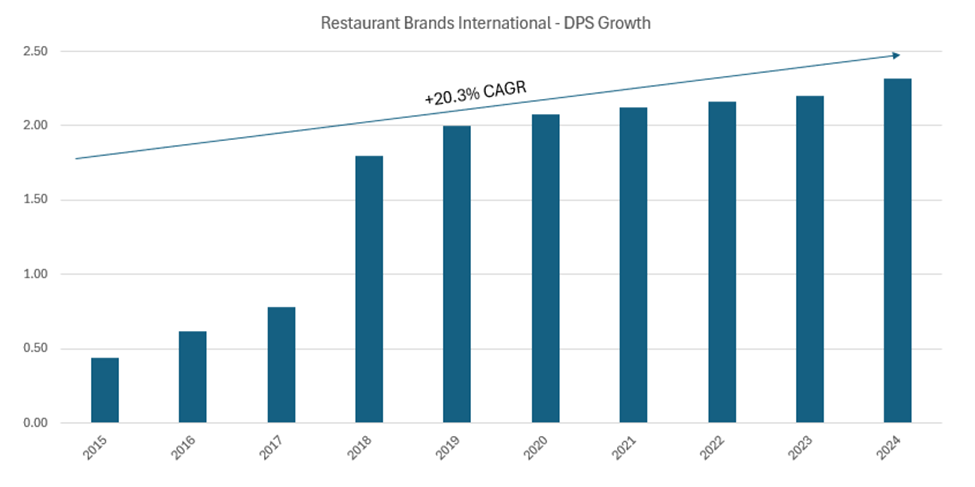
Figure 25 – DPS Growth of the Domino’s (2015-2024)
CapEx
As an industry with a relatively high proportion of fixed assets, we considered it important to include CapEx as well, in order to see how much each of the 5 companies are spending on extending their restaurant count, and also on modernizing their equipment. As such, we’ve decided to measure CapEx as a % of the annual revenue. It is quite clear from the below table, that McDonald’s has the highest CapEx rate out of the 5 companies, at 9.2%, while Restaurant Brands International had a <2% CapEx rate, which we find surprising, given that they’ve extended their restaurant count by c.+4% per year over the last 10 years.
Figure 26 – Capital Expenditures Analysis
Restaurant Count Growth
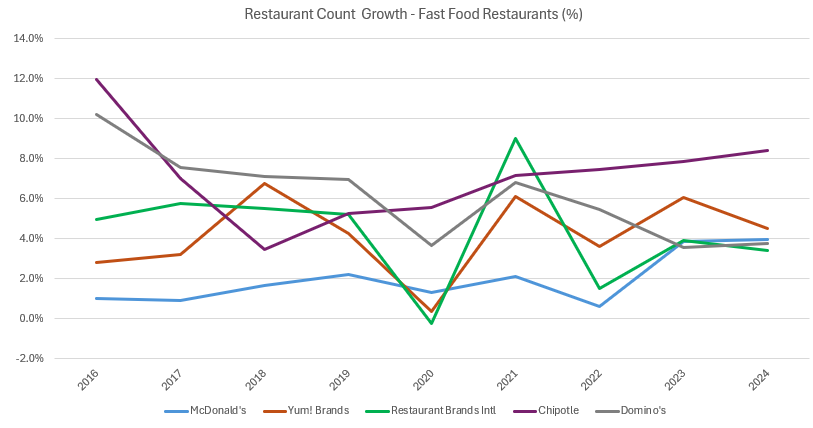
Overall, between 2016 and 2024, the number of locations for the five major fast-food chains grew at varied rates, reflecting differences in scale, strategy, and market conditions. McDonald’s had the slowest and most stable expansion, averaging around +2.0% annually, with growth consistently under +4% even in its best years—unsurprising given its massive global base of over 43,000 restaurants by 2024. Yum! Brands maintained steady expansion of roughly +4.5% per year toward the end of the period, after some slowdown in 2020, growing from around 42,000 to over 61,000 locations. Restaurant Brands International also grew at about +4.3% annually, with slight volatility around 2020–2021, ending with over 32,000 units. Domino’s saw robust early growth, averaging +6.1% over the period, but with a gradual decline from double-digit growth in 2016 to about +3.8% by 2024, reflecting maturing markets. Chipotle stood out with the fastest expansion, averaging +7.1% per year, maintaining strong momentum even after a pandemic dip, and growing its footprint from about 2,000 to nearly 4,000 locations. This variation underscores how maturity, brand strategy, and pandemic recovery shaped growth trajectories across the segment.
Figure 27 – Restaurant Count Growth of the sector (2016-2024)
Authors: János-Levente Bereczki, Ionuț-Adrian Lazar
Discover more from FSEGA Investment Club
Subscribe to get the latest posts sent to your email.