Intel reports flat revenue, but sharp loss in Q1 2025

Overview
Intel’s first quarter of 2025 showed signs of operational stabilization, despite persistent macroeconomic pressures and a competitive semiconductor landscape. Revenue remained flat year-over-year, while strategic actions around cost optimization and organizational streamlining began to take hold.
CEO Lip-Bu Tan emphasized: “The first quarter was a step in the right direction, but there are no quick fixes as we work to get back on a path to gaining market share and driving sustainable growth. I am taking swift actions to drive better execution and operational efficiency while empowering our engineers to create great products. We are going back to basics by listening to our customers and making the changes needed to build the new Intel.”
Q1 2025 vs. Q1 2024:
- Total revenue recorded a value of $12.7bn (flat YoY), supported by growth in Data Center & AI (DCAI) and Intel Foundry businesses, offset by declines in Client Computing Group (CCG).
- CCG revenue declined to $7.6bn (-8% YoY), driven by soft consumer demand and pricing pressure.
- DCAI revenue increased to $4.1bn (+8% YoY), fueled by ramp-up of Xeon 6 processors and stronger AI-related server demand.
- Intel Foundry revenue also grew to $4.7bn (+7% YoY), benefiting from external foundry partnerships and progress in manufacturing scale-up.
- Other revenues were $0.9bn (+47% YoY), primarily due to performance at Mobileye and early Altera contribution.
- GAAP net loss was $(821)m (compared to $(381)m in Q1 2024), reflecting continued margin compression, macro uncertainty, and restructuring-related charges.
- GAAP EPS recorded a value of $(0.19) (vs. $(0.09) in Q1 2024), driven by weaker gross margins and higher effective tax rate volatility.
- Non-GAAP net income decreased to $580m (-24% YoY), affected by lower gross margins and equity investment losses.
- Non-GAAP EPS also declined to $0.13 (vs. $0.18 in Q1 2024), impacted by lower profitability across Client Computing and equity portfolio adjustments.
- GAAP gross margin was 36.9% (-4.1pp YoY), primarily due to product mix, underutilization charges, and higher start-up costs for next-gen nodes.
- Cash from operations recorded a value of $0.8bn (improved from $(1.2)bn in Q1 2024), boosted by disciplined working capital management and divestiture proceeds.
- Adjusted free cash flow was $(3.7)bn (compared to $(6.2)bn in Q1 2024), reflecting ongoing fab investments and restructuring.
- The company reduced operating expense targets to ~$17bn for 2025 (non-GAAP), aiming for $16bn in 2026.
- Intel also lowered 2025 gross capital expenditure target to $18bn (from $20bn), focusing on core investments and foundry expansion.
- The company ended Q1 with $8.9bn (+8% YoY) in cash and $12.1bn (-12% YoY) in short-term investments.
For the second quarter of 2025, Intel issued cautious guidance, reflecting ongoing macroeconomic pressures and industry-specific headwinds. The company expects revenue to range between $11.2bn and $12.4bn. GAAP earnings per share are projected to be a loss of $(0.32), while non-GAAP EPS is expected to break even at approximately $0.00. Gross margins are forecasted at around 34.3% on a GAAP basis and 36.5% on a non-GAAP basis. Despite the challenging environment, Intel remains focused on executing its technology roadmap, advancing the ramp-up of its Intel 18A manufacturing node, and strengthening its competitive position in AI and foundry services.
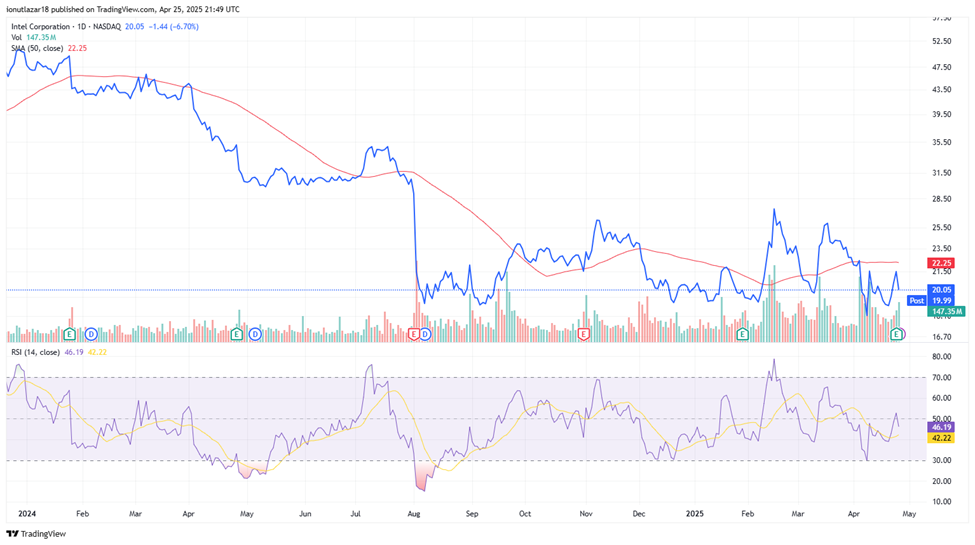
The results reported for the first quarter of this year, as well as the changing forecasts for the company’s future, did not bring good feelings at all among investors on Wall Street, with the stock price of INTC shares falling by approximately -6.7% on the day following the publication of the quarterly results. Thus, over the last month, the stock price has maintained this downward trend quite strongly, reaching a decrease of over -17%. Moreover, compared to the same period last year, the company’s stock price was in a real collapse, falling by approximately -43% year-on-year.
Author: Ionuț-Adrian Lazar
Discover more from FSEGA Investment Club
Subscribe to get the latest posts sent to your email.